Property Market in Review: 2014 - The Year Everything Went Gangbusters
The key events of 2014 that contributed to the hyperactive Australian real estate.
Click through for Tables – The key events of 2014 that contributed to the hyperactive Australian real estate.
A year is a very long time in the property market. It’s fair to say the market has gone gangbusters in 2014, compared to the same period in 2013. Onthehouse.com.au figures revealed that national residential property sales are just shy of the 500,000 mark.
As Table 1 demonstrates, total national sales reached 494,991 – a 12.7% increase from the previous year.
Table 1: House and Unit Sales

This increase was underpinned by strength in both the house and unit markets, with annual sales in each market closing at 340,197 (up 13.9% in the last year) and 154,794 (up 10.1% in the last year) respectively.
Unsurprisingly, house and unit prices also increased at the same time. The median house price in Australia increased by 7.85% to $474,500, while the median unit price increased by 7.77% to $439,500.
Table 2: Median House and Unit Values

Interestingly, units held their own with houses in terms of absolute and percentage median value growth,
This is not surprising given the trend towards higher density living driven by affordability, supply and location factors, and the changes in owner-occupier and investor preferences.
Capital cities lead the way
Tables 3 and 4 reveal that the eastern states led the way in capital city sales volumes, with 70% of house sales and 80% of unit sales occurring in Sydney, Melbourne and Brisbane.
Given around 50% of all dwellings are located in Sydney and Melbourne, this comes as no surprise and reflects a dichotomy in the Australian residential property market between these capitals and everywhere else.
Overall, around 58% of all house sales and 76% of all unit sales in Australia were conducted in our state capitals.
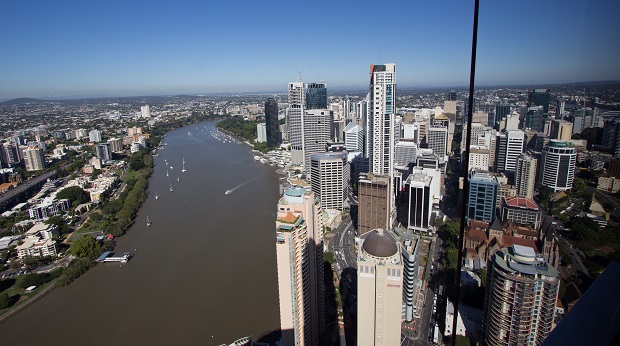
All three eastern capitals saw big increases in transaction volumes over the past 12 months with Sydney leading the way in terms of numbers and Brisbane in terms of percentage increase.
These figures indicate a strong and active housing market that reflects high demand for city and suburban properties driven by employment patterns and location preferences – in other words, people want to live in established areas close to work, schools, transports, shops and other amenities.
Table 3: House Sales
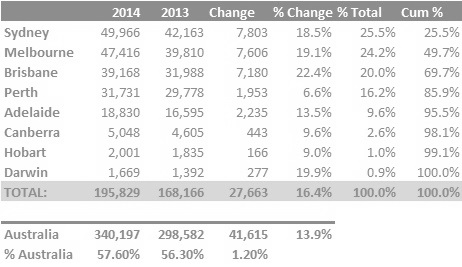
Table 4: Unit Sales
On the back of higher sales figures, median values have also shown some significant increases (see Tables 5 and 6). Again, Sydney was the clear standout (house values increased by 15.9% and units went up 13.8%) while Melbourne also performed strongly (houses up 10.3% and units increased 5.6%).
Other than Canberra Units and Darwin Houses, all other capital city markets saw median value increases. However, in many cases, these increases were at or below the rate of inflation – meaning there was little or no growth in real terms.

The quantum and direction of growth in capital city property prices in the eastern states has resulted in some interesting developments.
For example, if the rate of Sydney house price growth continues into 2015 then the median price may hit the $1,000,000 mark next year – a significant threshold. Similarly, a Sydney median unit is now more expensive than every other capital median house other than Melbourne. This is another interesting and significant development in that the price relativity between Sydney units and almost every capital city house market reflect possible barriers to downsizing to a Sydney unit, especially if you’re from interstate. And with growth in Melbourne following Sydney, affordability issues are further exacerbated in Australia’s two biggest capital cities.
Eventually, there will need to be a slowdown in the rate of growth in property values, especially in the eastern states, otherwise the rate of owner-occupiers will start to fall as more and more aspiring home owners are priced out of the market.
Table 5: Capital City Median House Values

Table 6: Capital City Median Units Values

Key Growth Drivers
While there are many factors that determine house price movements, there were probably three stand-out drivers over the past year:
1. Population Growth
Increasing population means more homes are needed
According to the Australian Bureau of Statistics (ABS), Australia’s population grows by one person every 80 seconds, driven largely by international migration.
To put his into perspective, this means our population grows by around 1,080 people per day, or around 400,000 people per year.
If we are being conservative, we’d assume that the annual population increase results in new housing demand at the rate of three people per household – meaning around 133,000 new homes are needed every year to accommodate our new arrivals.
This is in addition to those in our existing population who have aspirations to become homeowners themselves – for example, young Australians looking to leave home or those currently renting. If we factor this in, we are need additional housing of around 160,000 homes per annum, if not more.
The lack of reasonable and cost effective new housing to meet our ever growing demand is an ongoing and perennial problem – something I have alluded to in my columns over the years. And so, over the past year, the simple law of supply and demand – or more correctly lack of desirable supply, raised its ugly head and was a major contributing factor underpinning residential property price rises as demand for property in city and suburban areas outstripped supply, especially in the eastern states.
- Cheap Home Loan Finance
Cheap finance means more people can afford to enter the market
Of course, another major driver of demand is the availability and cost of home loan finance. And in this regard all the lenders played their part.
Over the past 12 months we’ve seen an aggressive and sustained marketing campaign (especially by the big four banks) to exploit the low interest rate environment and increase their balance sheets and profits through home loan lending. And this continues even today.
Understandably, owner occupiers and investors responded positively as they looked to secure historically cheap finance for both variable and fixed rate lending.
In fact they responded in their droves which saw higher transactions (driven by more buyers entering the market), increased competition for desirable properties in sought after locations, and consequently higher prices being paid – made possible in no small way by cheap home loans and I suspect more favourable lending guidelines.
- Confidence in the Residential Property Market
Confidence in the housing market means more people are willing to buy property
When enough of us feel reasonably confident about the state of the economy and our personal finances (I say reasonably because both consumer and business confidence is and has been a bit up and down over the past 12 months), more of us are prepared to take on the long term commitment of a home or investment loan.
Factors such as the cash rate and mortgage rates being held at very low levels, inflation pretty much under control, unemployment hovering around a manageable (albeit increasing) 6% and a robust and active property market, translate nicely into providing emotional and financial security that the property market is a good place to invest. The significantly higher transaction numbers and overall growth in median property values further reflects this.
Another deciding factor was probably that many people entered the property market, whether as owner-occupiers or as investors, to ensure they got a foothold on the property ladder before prices increased further and/or borrowing conditions turned less favourable. For this group of people, it was likely a case of buy now or risk missing out altogether.
Conclusion
The past 12 months has seen some good growth in the Australian residential property market, albeit driven largely by strong performances in the eastern states.
Median values are up, property transactions are up and most people who have owned their property for more than a year are probably feeling pretty pleased with how things have panned out.
Conditions are likely to remain positive in 2015, but growth rates are likely to slow.
Stay tuned for 2015 forecasting.
[contact-form][contact-field label=’Name’ type=’text’ required=’1’/][contact-field label=’Email’ type=’text’ required=’1’/][contact-field label=’Contact Number’ type=’text’ required=’1’/][/contact-form]
*NOTE: Data in this article is for the year ending September 2014. Author: Peter Boehm for Onthehouse.com.au