Suburb Profiles – Annerley, Yeronga, Moorooka, Fairfield April 2016
Based on a number of analytic data reports pulled from Core Logic–RP Data today, our team have compiled an overview of sales activity statistics in the Inner-city South Brisbane suburbs of Annerley, Yeronga, Moorooka and Fairfield. We will also take a look at demographic types in each suburb, finding out the percentage of occupants who are renting, purchasing, owning outright and other.
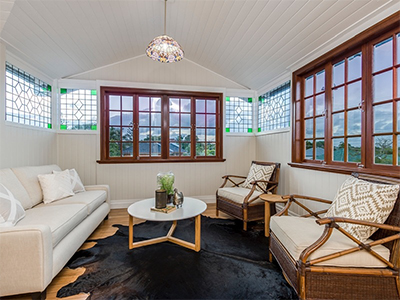
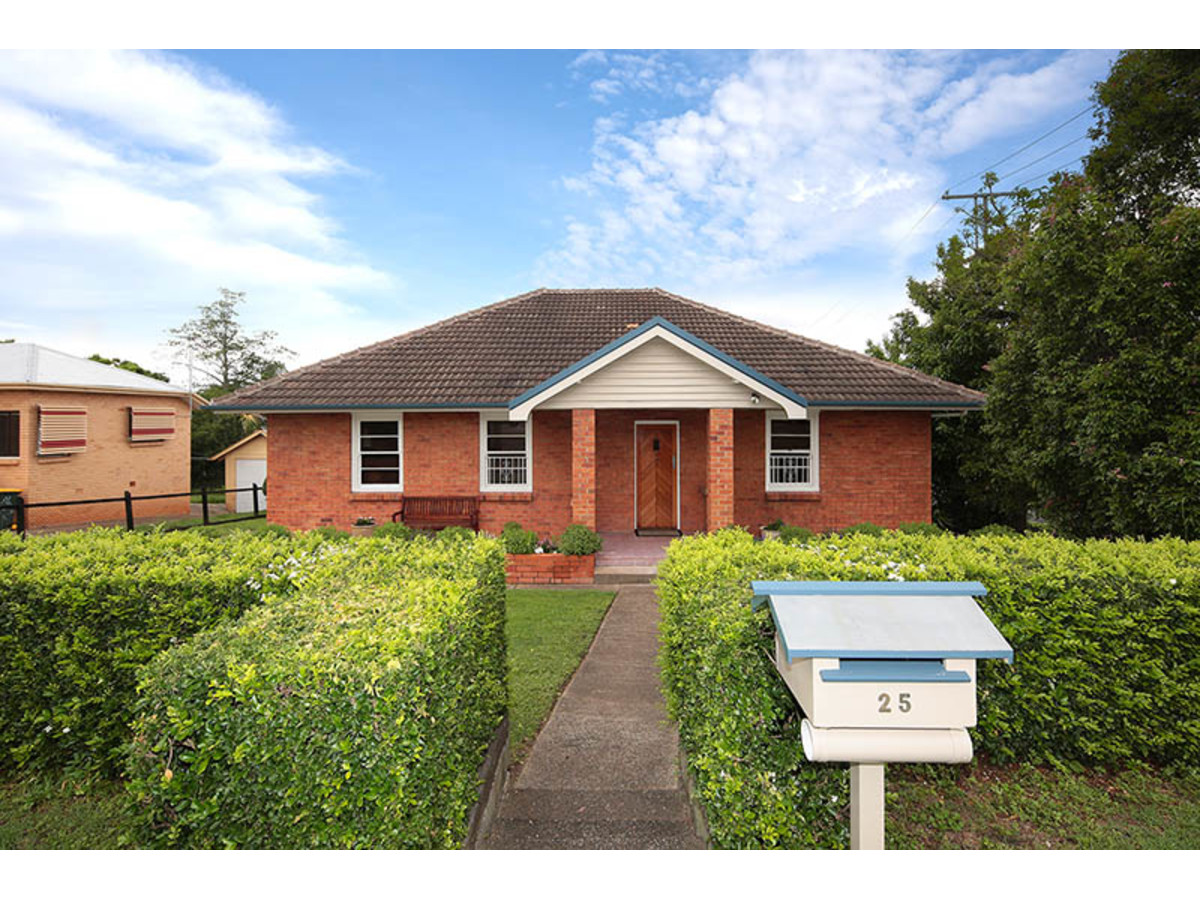
ANNERLEY
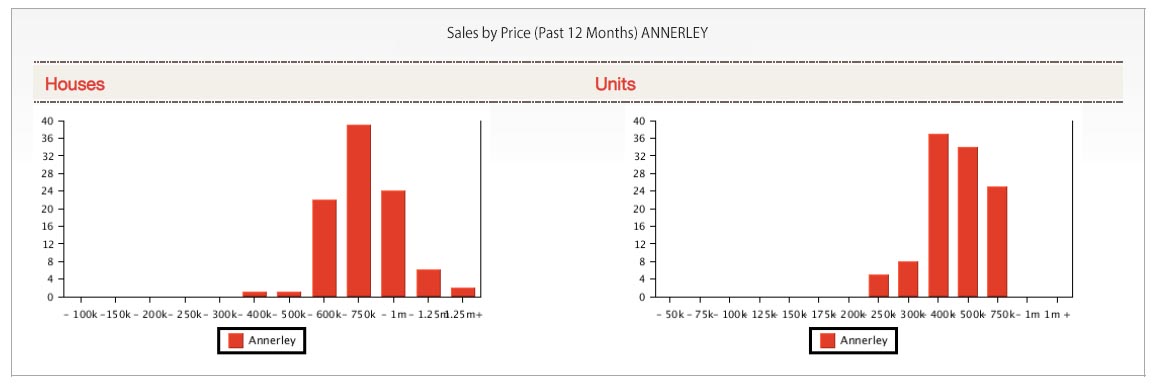
In the past 12 months in Annerley the clear majority of houses sold in the suburb went for between $700K and $750K. The majority of units went around the $400K mark. A total of 263 houses and units were sold in Annerley in 2015.
YERONGA

While in Yeronga in the past 12 months the clear majority of homes sold over this rolling 12 month period were around the $750K price. While similar to Annerley’s house prices in the past year, Yeronga’s unit prices beat Annerley by around $100K with the majority selling at around the $500K bracket in the last year.
MOOROOKA
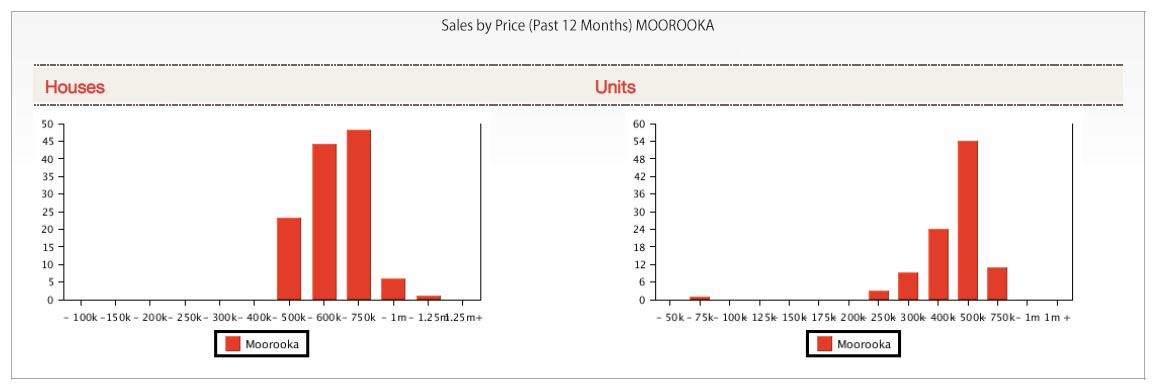
In Moorooka over the last 12 Months of the majority of houses sold around $750K followed closely by $600K. While most units in the suburb have clearly been selling with a price tag of $500K across 2015 and this first part of 2016. The total number of sales for 2015 in Moorooka was 129 while a total number of 149 houses sold in the suburb.
FAIRFIELD

Fairfield, the smallest suburb of these four, has understandably the lowest number of sales across 2015. Equating a total number of 61, of which 42 were houses and 19 were units. Despite the smaller suburb size, Fairfield has had stronger sales in 2016 so far with already, 4 houses and 7 units sold. In the last 12 months, the majority of houses sold at around $750K while most units sold at around $500 K in the suburb.
OCCUPANCY DEMOGRAPHIC SEGMENTS BY SUBURB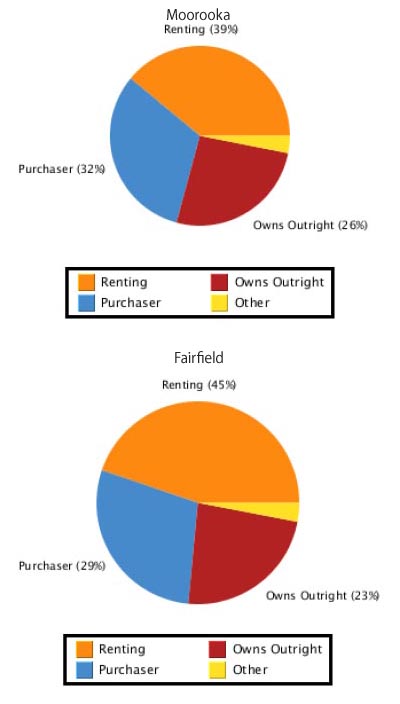
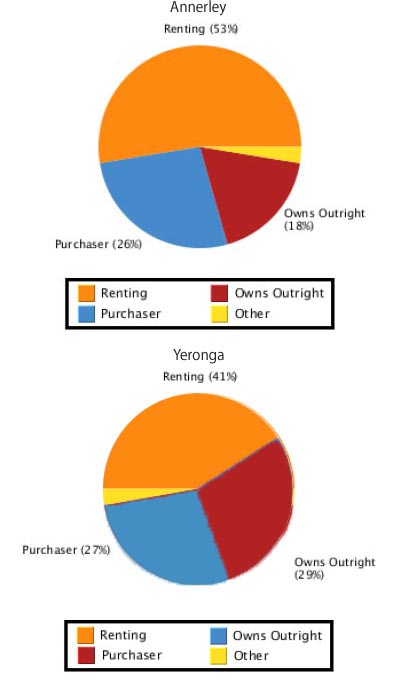
The four pie graphs shown to the left and right here break down the occupant types for each suburb into the percentage which rent, own their home outright, are currently purchasing their home or otherwise.
The main takeaways we can see in the following graphs are that rental occupancy in these areas are between 39% and 53%.
53% of occupants in Annerley are renting while 44% either ow
n their home outright or are currently purchasing.
In Yeronga, 41% of occupants are renting while 56% own outright or are purchasing with 29% owning their home outright in that area.
In Moorooka, the lowest percentage of occupants in these four suburbs are renters comprising 39% with 26% owning outright and 32% currently purchasing.
In Fairfield 45% are renters, 23% own outright while 29% are purchasing.